Multifamily occupancy and rent comparisons through February 2023
This analysis looks at the change in occupancy and rent levels for twelve multifamily markets across Texas, Arizona, Georgia, Tennessee, North Carolina, and Florida from the onset of the pandemic to the end of February 2023.
Occupancy changes
The pandemic has put into motion a series of extremes from historic job losses in 2020 spawned from the economic lockdown to equally historic job gains in 2021 launched by the economic reopening. Figure A compares occupancy levels at the end of 2021, when overall occupancy was soaring, to the most current snapshot of occupancy at the end of February. Figure A shows the magnitude of the percentage point drops with San Antonio exhibiting the greatest decline on the far left of the slide, progressing to the right with Orlando experiencing the least volatility in occupancy decline.
Figure A – Occupancy Changes
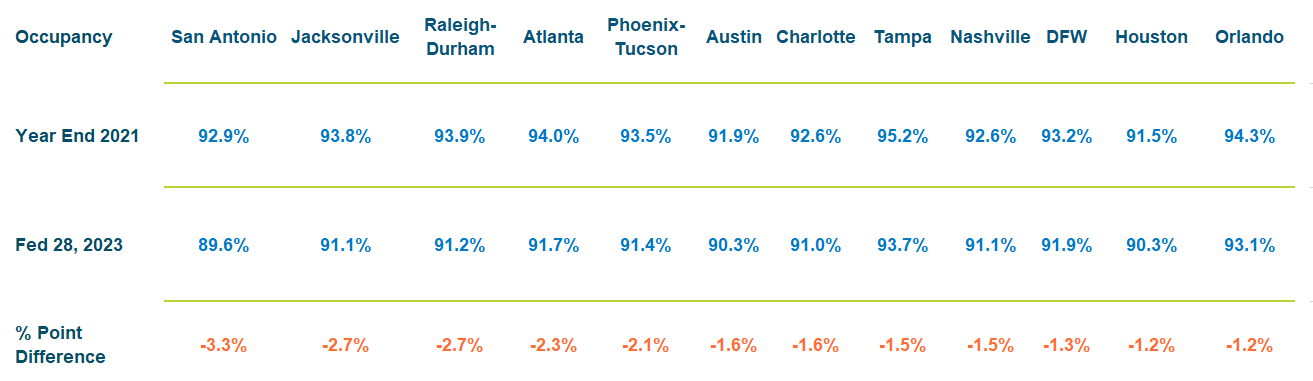
The drop in occupancy levels across all markets has been driven by a curious exodus of renters from Classes B, C and D. Some of the moveouts can be traced to the evictions process that was put on hold by a moratorium that began in 2020 and finally expired in August of 2021. Some renters sought more affordable accommodations by doubling-up or moving in with relatives, which is behavior reminiscent of past recessions. In addition, renters are moving into the shadow market of single-family rentals owned by Mom & Pop operators as well as by corporate entities that substantially increased their supply in 2021. Class A is driving every bit of positive absorption from would-be single-family prospects that are priced out of buying and choosing to rent until mortgage rates and stubbornly high prices subside.
Annual rent growth since pandemic
Figure B captures rent growth amassed since 2020, through 2022. The green percentage values at the top of every bar represent the sum of rent growth over this time frame. Tampa has cobbled together the highest rent growth over the last three years at 39.8%. Tampa is positioned on the left-hand side of the graph with the other markets’ rent growth trending lower to the right.
Figure B – Rent Growth Since Pandemic
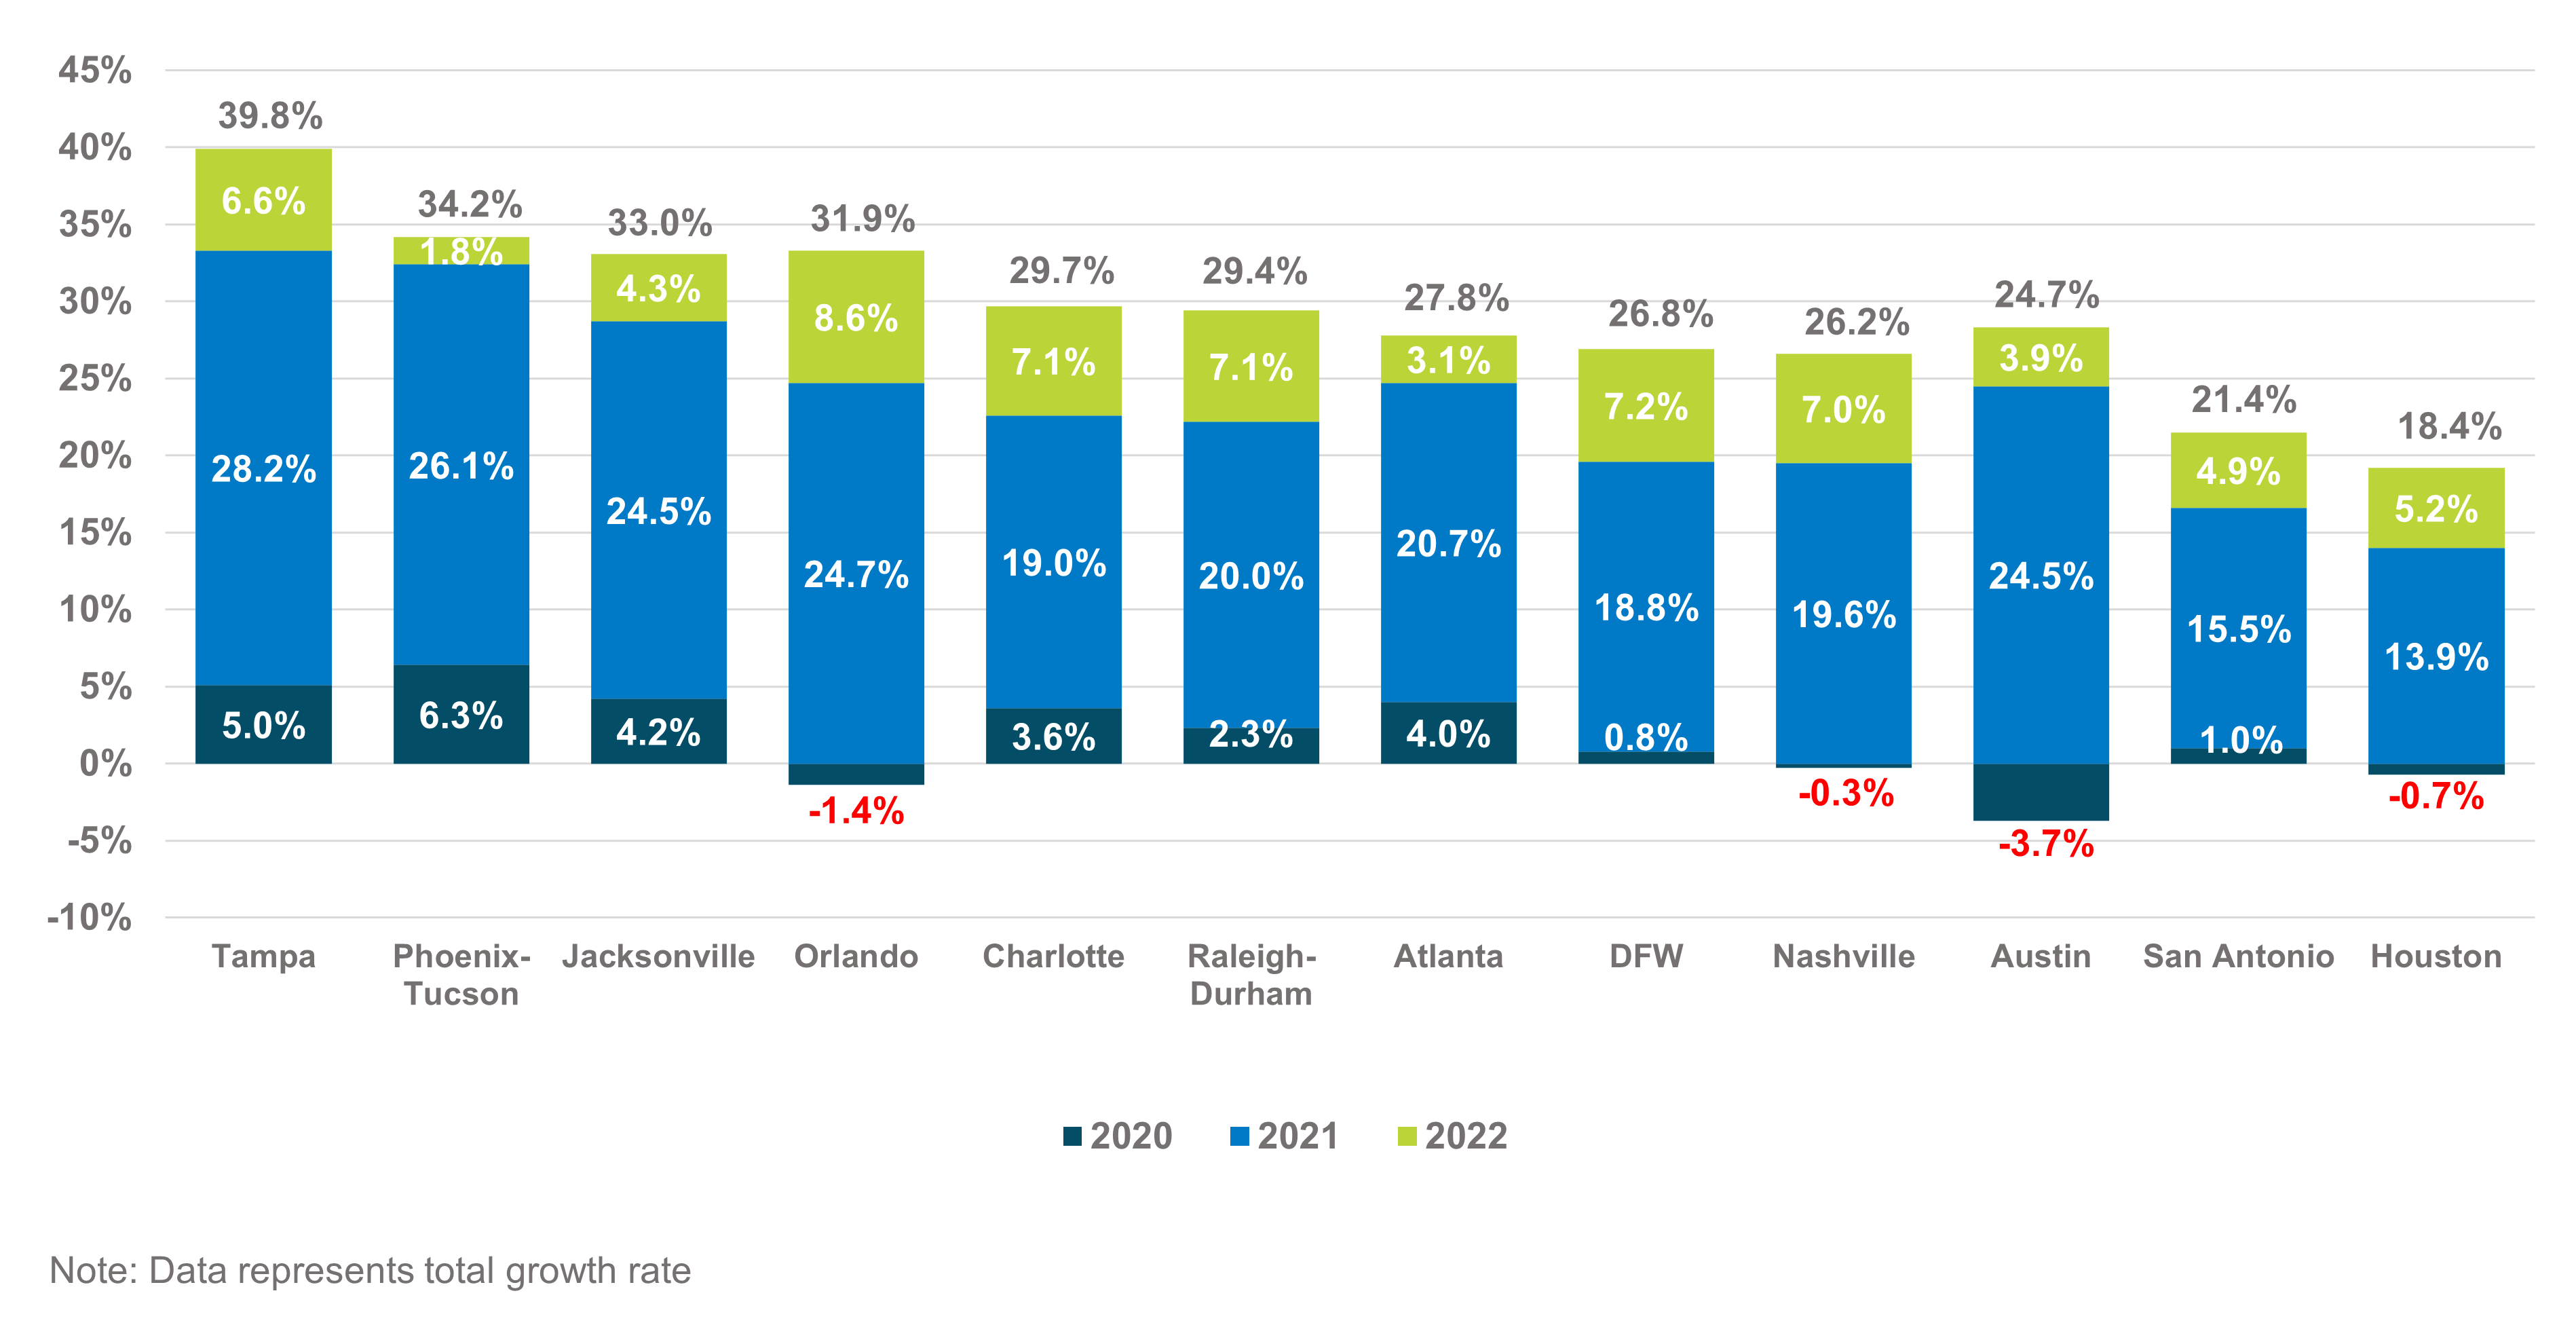
In 2020, the economic lockdown year, most markets’ rent growth was constrained when compared to long-term growth averages. The 2020 rent growth values appear in the blue portion at the bottom of each bar. All markets were initially stunned at the onset of the pandemic, yet some markets were able to recover quickly and achieve rent growth that defied the lockdown. Looking at Phoenix-Tucson with rent growth of 6.3% and Tampa with 5.0%, one might ask, “what lockdown?” Following with moderate rent growth despite the pandemic headwinds were Jacksonville, Charlotte, and Atlanta. Markets that took the hardest hit with flat to negative rent growth were Orlando, Nashville, and Houston. Austin has the distinction of losing the most rental ground at 3.7%.
In 2021, the economic transition from lock-down to reopening was cosmic. Rent levels skyrocketed as represented by the golden color on each bar. This rent growth performance is easily four times the long-term average growth.
In 2022, prevailing wisdom advised that the rent growth achieved in 2021 was unsustainable and that rent growth would revert to the mean or long-term averages in 2022. The rent growth values for 2022 are represented in the grey portion at the top of each bar. Certainly, rent growth has settled from the mercurial levels of 2021; however, in most cases, rent growth has remained elevated over long-term averages which typically ranges between 4.0% to 6.0%. Phoenix-Tucson now stands out as the softest market at 1.8% with Atlanta, Austin, and Jacksonville showing reasonably good growth but falling below their long-term trends. Orlando leads the pack at 8.6% for 2022.
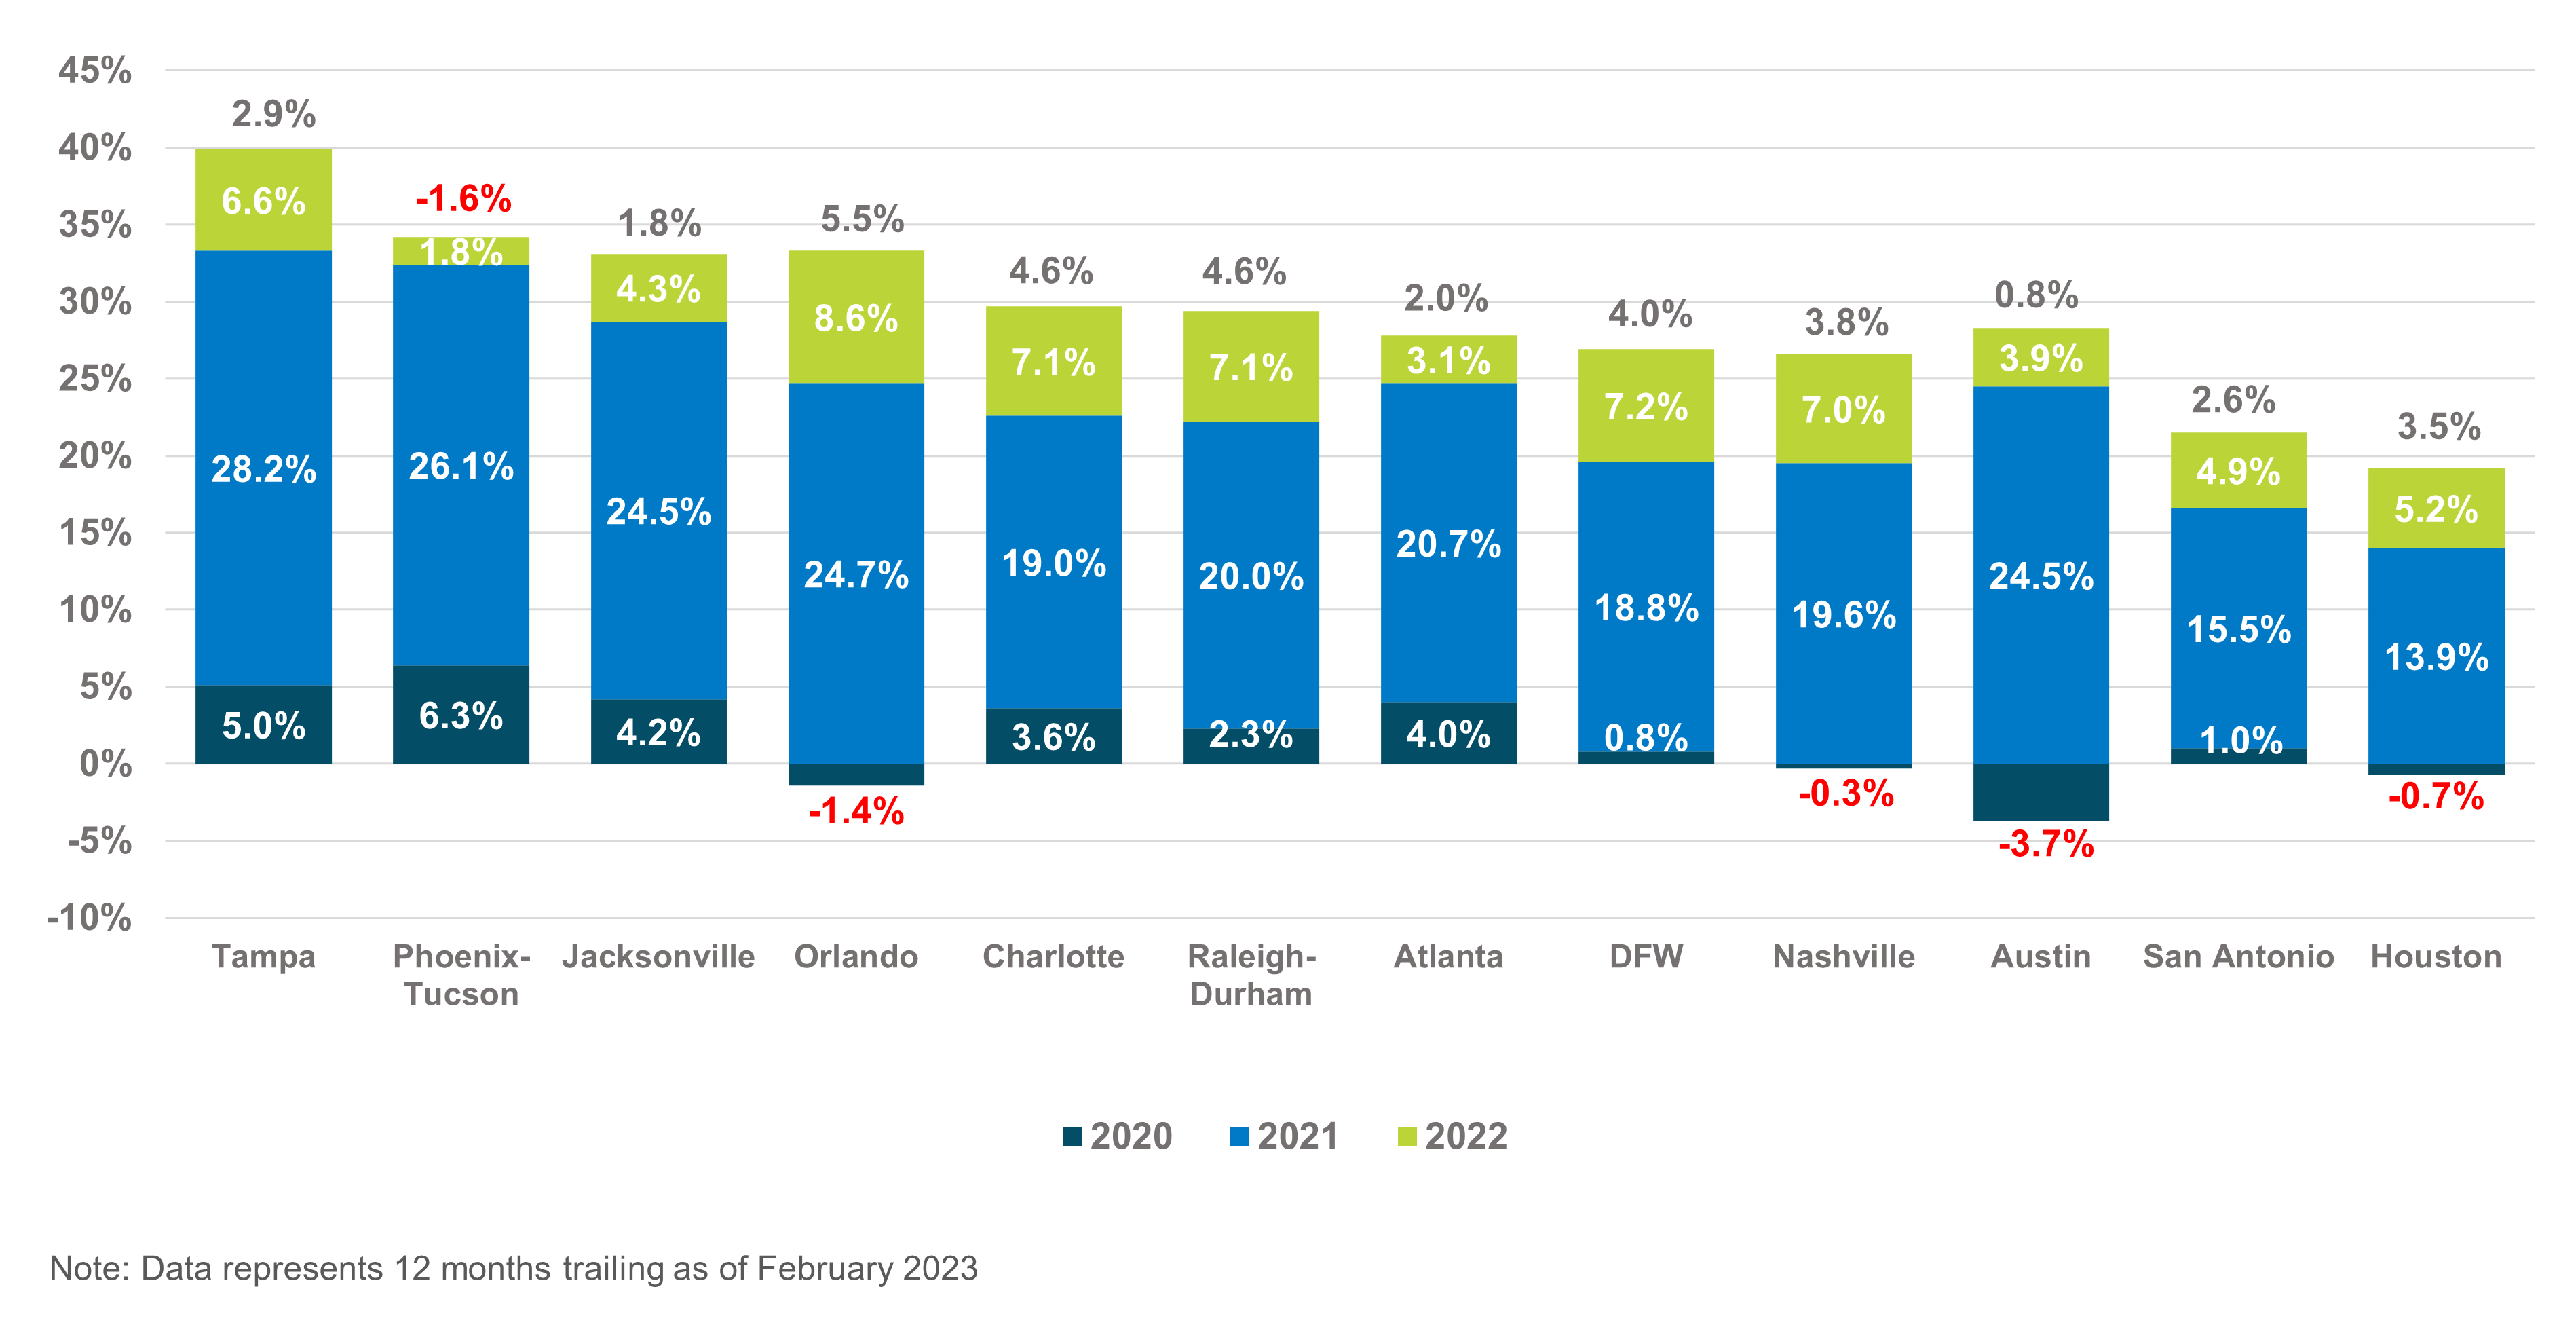
Current rent growth over pandemic
Figure C restates the previous Rent Growth Since Pandemic chart but inserts the current 12-Month Trailing rent growth as of the end of February 2023 at the top of each bar. Rent growth percentages continue to fall. Most markets are now trending below long-term averages. The once high-flying Phoenix-Tucson market now has negative 1.6% growth and Austin is flat at 0.8%. Orlando continues to lead with rent growth of 5.5%, while North Carolina markets and DFW are coming in over 4.0%.
Figure C – Current Rent Growth Over Pandemic
What to expect for 2023
The direction of these trends is concerning. Are we at a seasonal pivot point where demand traditionally moves higher from March to July? If so, rent levels will firm around the 3.0% to 5.0% range for most of these markets in 2023. Or are we still in the throes of pandemic-induced fluctuations that play havoc with established patterns of seasonality and standards of analysis?
Another concern is the level of new construction deliveries in some markets. The unprecedented number of units set for delivery in 2023 could trigger a more concessionary environment in Austin, Phoenix, and Atlanta. Stay tuned as we continue reporting on market conditions for 2023.
Interested in learning more? View additional detail on rental rate, occupancy and absorption trends in our monthly Market Line Reports.
Multifamily Industry Review: Leaving 2023 Behind and Discussing 2024 Trends
The economic fluctuations, slowing job growth, and surging supply that defined the multifamily market in 2023 are poised to prolong the pattern of market unpredictability that has become the new normal. As rent trends and job growth settle back into …